Notes: Spark metrics
Below are some notes taken for future reference based on the brainstorm meeting last week, with company confidential information removed.
Background
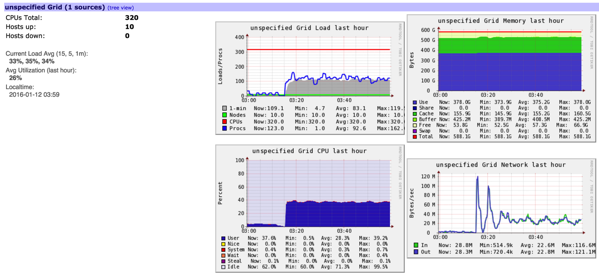
The team use a home made workflow to manage the computation for the cost and profit, and there’s a lack of statistics for the jobs and input/output, usually SDE/oncall checks the data in Data Warehouse or TSV files on S3 manually. For EMR jobs, Spark UI and Ganglia are both powerful but when the clusters are terminated, all these valuable metrics data are gone.

Typical use cases:
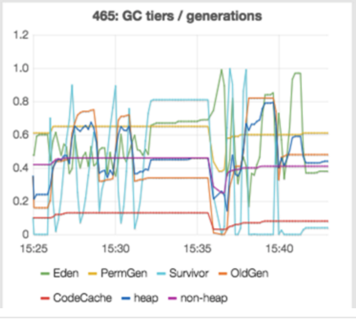
- Spark metrics: status / efficiency / executor / GC …
- EMR cluster / instance metrics: CPU / memory / IO/ network …
- Workflow: task time cost distribution for each running, time cost comparison between different runnings of a same pipeline and task dependency graph
- Health status: critical pipeline statuses should be monitored and presented daily, including pipeline status itself and the input / output scale
- Metrics lib integration: We need a dedicated component to gather metrics from code, this can cover the case that the metrics is tightly connected with the code logic. It’s more like the regular “log”, but cares more about the data on metrics side.
- (Sev-2) Ticket linkage: display on going ticket information, with related job/components links appended, and component owner should be clearly displayed
I. Metrics for Spark jobs
Metrics when cluster is running – Ganglia and Spark UI, and we can even ssh to the instance to get any information. But the main problem happens when the cluster is terminated:
1. Coda Hale Metrics Library (preferred)
In latest Spark documents there is an introduction guiding how to integrate the metrics lib. Spark has a configurable metrics system based on the Coda Hale Metrics Library (link1, link2). This allows users to report Spark metrics to a variety of sinks including HTTP, JMX, and CSV files:
- configuration: $SPARK_HOME/conf/metrics.properties or spark.metrics.conf
- supported instances: master / applications / worker / executor / driver
- sinks: ConsoleSink / CSVSink / JmxSink / MetricsServlet / GraphiteSink / Slf4jSink and GangliaSink (needs custom build for license)
We can also implement an S3Sink to upload the metrics data to S3. Or, call MetricsServlet to get metrics data termly and transfer the data to a data visualization system. To get the data when a Spark job is running, besides checking the Spark UI, there’s also a group of RESTful API to make full use of, which is good for long term metrics persistence and visualization.
Example: Console Sink, simply output the metrics like DAG schedule to console:
-- Gauges ----------------------------------------------------------------------
DAGScheduler.job.activeJobs
             value = 0
DAGScheduler.job.allJobs
             value = 0
DAGScheduler.stage.failedStages
             value = 0
DAGScheduler.stage.runningStages
             value = 0
DAGScheduler.stage.waitingStages
             value = 0
application_1456611008120_0001.driver.BlockManager.disk.diskSpaceUsed_MB
             value = 0
application_1456611008120_0001.driver.BlockManager.memory.maxMem_MB
             value = 14696
application_1456611008120_0001.driver.BlockManager.memory.memUsed_MB
             value = 0
application_1456611008120_0001.driver.BlockManager.memory.remainingMem_MB
             value = 14696
application_1456611008120_0001.driver.jvm.ConcurrentMarkSweep.count
             value = 1
application_1456611008120_0001.driver.jvm.ConcurrentMarkSweep.time
             value = 70
application_1456611008120_0001.driver.jvm.ParNew.count
             value = 3
application_1456611008120_0001.driver.jvm.ParNew.time
             value = 95
application_1456611008120_0001.driver.jvm.heap.committed
             value = 1037959168
application_1456611008120_0001.driver.jvm.heap.init
             value = 1073741824
application_1456611008120_0001.driver.jvm.heap.max
             value = 1037959168
application_1456611008120_0001.driver.jvm.heap.usage
             value = 0.08597782528570527
application_1456611008120_0001.driver.jvm.heap.used
             value = 89241472
application_1456611008120_0001.driver.jvm.non-heap.committed
             value = 65675264
application_1456611008120_0001.driver.jvm.non-heap.init
             value = 24313856
application_1456611008120_0001.driver.jvm.non-heap.max
             value = 587202560
application_1456611008120_0001.driver.jvm.non-heap.usage
             value = 0.1083536148071289
application_1456611008120_0001.driver.jvm.non-heap.used
             value = 63626104
application_1456611008120_0001.driver.jvm.pools.CMS-Old-Gen.committed
             value = 715849728
application_1456611008120_0001.driver.jvm.pools.CMS-Old-Gen.init
             value = 715849728
application_1456611008120_0001.driver.jvm.pools.CMS-Old-Gen.max
             value = 715849728
application_1456611008120_0001.driver.jvm.pools.CMS-Old-Gen.usage
             value = 0.012926198946603497
application_1456611008120_0001.driver.jvm.pools.CMS-Old-Gen.used
             value = 9253216
application_1456611008120_0001.driver.jvm.pools.CMS-Perm-Gen.committed
             value = 63119360
application_1456611008120_0001.driver.jvm.pools.CMS-Perm-Gen.init
             value = 21757952
application_1456611008120_0001.driver.jvm.pools.CMS-Perm-Gen.max
             value = 536870912
application_1456611008120_0001.driver.jvm.pools.CMS-Perm-Gen.usage
             value = 0.11523525416851044
application_1456611008120_0001.driver.jvm.pools.CMS-Perm-Gen.used
             value = 61869968
application_1456611008120_0001.driver.jvm.pools.Code-Cache.committed
             value = 2555904
application_1456611008120_0001.driver.jvm.pools.Code-Cache.init
             value = 2555904
application_1456611008120_0001.driver.jvm.pools.Code-Cache.max
             value = 50331648
application_1456611008120_0001.driver.jvm.pools.Code-Cache.usage
             value = 0.035198211669921875
application_1456611008120_0001.driver.jvm.pools.Code-Cache.used
             value = 1771584
application_1456611008120_0001.driver.jvm.pools.Par-Eden-Space.committed
             value = 286326784
application_1456611008120_0001.driver.jvm.pools.Par-Eden-Space.init
             value = 286326784
application_1456611008120_0001.driver.jvm.pools.Par-Eden-Space.max
             value = 286326784
application_1456611008120_0001.driver.jvm.pools.Par-Eden-Space.usage
             value = 0.23214205486274034
application_1456611008120_0001.driver.jvm.pools.Par-Eden-Space.used
             value = 66468488
application_1456611008120_0001.driver.jvm.pools.Par-Survivor-Space.committed
             value = 35782656
application_1456611008120_0001.driver.jvm.pools.Par-Survivor-Space.init
             value = 35782656
application_1456611008120_0001.driver.jvm.pools.Par-Survivor-Space.max
             value = 35782656
application_1456611008120_0001.driver.jvm.pools.Par-Survivor-Space.usage
             value = 0.3778301979595925
application_1456611008120_0001.driver.jvm.pools.Par-Survivor-Space.used
             value = 13519768
application_1456611008120_0001.driver.jvm.total.committed
             value = 1103634432
application_1456611008120_0001.driver.jvm.total.init
             value = 1098055680
application_1456611008120_0001.driver.jvm.total.max
             value = 1625161728
application_1456611008120_0001.driver.jvm.total.used
             value = 152898864

-- Timers ----------------------------------------------------------------------
DAGScheduler.messageProcessingTime
             count = 4
         mean rate = 0.13 calls/second
     1-minute rate = 0.05 calls/second
     5-minute rate = 0.01 calls/second
    15-minute rate = 0.00 calls/second
               min = 0.06 milliseconds
               max = 6.99 milliseconds
              mean = 1.78 milliseconds
            stddev = 2.98 milliseconds
            median = 0.07 milliseconds
              75% <= 0.08 milliseconds
              95% <= 6.99 milliseconds
              98% <= 6.99 milliseconds
              99% <= 6.99 milliseconds
            99.9% <= 6.99 milliseconds
Load the metrics config:
1. Create a metrics config file: /tmp/metrics.properties based on the template in bootstrap step.
2. Configure to load the file when starting Spark:
- command line: appending –conf “spark.metrics.conf=/tmp/metrics.properties” doesn’t work, didn’t try -Dspark.metrics.conf=/tmp/metrics.properties
- an alternative is –files=/path/to/metrics.properties –conf spark.metrics.conf=metrics.properties, have’t try that
- in code: .set(“spark.metrics.conf”, “/tmp/metrics.properties”), this works
Metrics config file example:
*.sink.console.class=org.apache.spark.metrics.sink.ConsoleSink
*.sink.console.period=20
*.sink.console.unit=seconds
master.sink.console.period=15
master.sink.console.unit=seconds

*.sink.csv.class=org.apache.spark.metrics.sink.CsvSink
*.sink.csv.period=1
*.sink.csv.unit=minutes
*.sink.csv.directory=/tmp/metrics/csv
worker.sink.csv.period=1
worker.sink.csv.unit=minutes

*.sink.slf4j.class=org.apache.spark.metrics.sink.Slf4jSink
*.sink.slf4j.period=1
*.sink.slf4j.unit=minutes
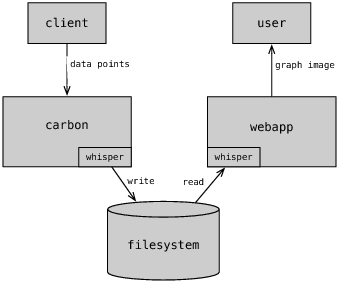
Coda Hale Metrics Library also supports Graphite Sink (link1, link2), which stores numeric time-series data and render graphs of them on demand.

Graphite consists of 3 software components:
- carbon – a Twisted daemon that listens for time-series data, which receives the data published by Graphite Sink on EMR
- whisper – a simple database library for storing time-series data (similar in design to RRD)
- graphite webapp – A Django webapp that renders graphs on-demand using Cairo

2. Sync Existing Metrics Data to S3 (not recommended)
- step 1, write some bootstrap scripts to sync metrics data from EMR cluster to S3 incrementally and timely
- step 2, after that, a possible way to restore these metrics in the same visualization is having a tool (environment) to download it from S3 and start the Spark History Server on it, or we can make some simple tool to get and analyze the metrics on S3
Other metrics data:
- OS profiling tools such as dstat, iostat, and iotop can provide fine-grained profiling on individual nodes.
- JVM utilities such as jstack for providing stack traces, jmap for creating heap-dumps, jstat for reporting time-series statistics and jconsole.
II. EMR cluster/instance Metrics
What metrics we already have even clusters are terminated?
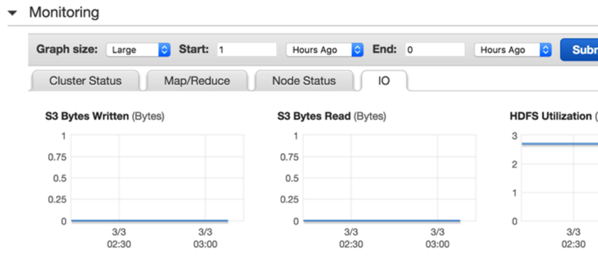
1. EMR cluster monitor
- Cluster status – idle/running/failed
- Map/Reduce – map task running/remaining …
- Node status – core/task/data nodes …
- IO – S3/HDFS r & w

2. CloudWatch
Basic monitor and alert system built based on SNS is already itegrated.

文章未经特殊标明皆为本人原创,未经许可不得用于任何商业用途,转载请保持完整性并注明来源链接《四火的唠叨》