发表于
2015-09-03 03:18:36
MySQL 5.6 Database Administrator-069-Which action should be taken to remove the performance bottleneck described here?
You are investigating the performance of the server and see the following information:
Events_waits_summary_global_by_event_name in the performance schema shows that the
wait/synch/mutex/sql/LOCK_table_cache event is dominating other wait events.
The table_open_cache_overflows status variable is 0.
Which action should be taken to remove the performance bottleneck described here?
A.
Decrease the value of table_definition_cache.
B.
Increase the value of table_definition_cache.
C.
Decrease the value of table_open_cache.
D.
Increase the value of table_open_cache.
E.
Decrease the value of tab
...继续阅读
(130)
发表于
2015-09-03 03:18:36
MySQL 5.6 Database Administrator-069-Which action should be taken to remove the performance bottleneck described here?
You are investigating the performance of the server and see the following information:
Events_waits_summary_global_by_event_name in the performance schema shows that the
wait/synch/mutex/sql/LOCK_table_cache event is dominating other wait events.
The table_open_cache_overflows status variable is 0.
Which action should be taken to remove the performance bottleneck described here?
A.
Decrease the value of table_definition_cache.
B.
Increase the value of table_definition_cache.
C.
Decrease the value of table_open_cache.
D.
Increase the value of table_open_cache.
E.
Decrease the value of tab
...继续阅读
(105)
发表于
2015-09-03 03:17:41
MySQL 5.6 Database Administrator-068-Which command will fix this issue?
You are creating a new server with the same accounts as an existing server. You do this by importing a mysqldump file of the mysql database.
You test whether the import was successful by using the following commands:
Mysql> select user, host, password from mysql.user;9 rows in set (0.00 sec)
Mysql> show grants for ‘admin’@’%’;
ERROR 1141 (42000): There is no such grant defined for user ‘admin’ on host ‘%’
Which command will fix this issue?
A.
CREATE USER ‘admin’ @’%’;
B.
GRANT USAGE ON *.* TO ‘admin’@’%’;
C.
FLUSH PRIVILEGES;
D.
FLUSH HOST CACHE;
E.
UPDATE mysql.user SET Create_user_priv
...继续阅读
(157)
发表于
2015-09-03 03:17:41
MySQL 5.6 Database Administrator-068-Which command will fix this issue?
You are creating a new server with the same accounts as an existing server. You do this by importing a mysqldump file of the mysql database.
You test whether the import was successful by using the following commands:
Mysql> select user, host, password from mysql.user;9 rows in set (0.00 sec)
Mysql> show grants for ‘admin’@’%’;
ERROR 1141 (42000): There is no such grant defined for user ‘admin’ on host ‘%’
Which command will fix this issue?
A.
CREATE USER ‘admin’ @’%’;
B.
GRANT USAGE ON *.* TO ‘admin’@’%’;
C.
FLUSH PRIVILEGES;
D.
FLUSH HOST CACHE;
E.
UPDATE mysql.user SET Create_user_priv
...继续阅读
(66)
发表于
2015-09-03 03:13:03
MySQL 5.6 Database Administrator-067-WWhich two statements are true about setting the per-thread buffers higher than required?
Which two statements are true about setting the per-thread buffers higher than required?
A.
More memory per thread is beneficial in all scenarios.
B.
It causes increased overhead due to initial memory allocation.
C.
It can affect system stability during peak load times, due to swapping.
D.
It requires increasing the thread_cache_size variable.easy2hide start{reply_to_this=true}答案:CDeasy2hide end
...继续阅读
(32)
发表于
2015-09-03 03:13:03
MySQL 5.6 Database Administrator-067-WWhich two statements are true about setting the per-thread buffers higher than required?
Which two statements are true about setting the per-thread buffers higher than required?
A.
More memory per thread is beneficial in all scenarios.
B.
It causes increased overhead due to initial memory allocation.
C.
It can affect system stability during peak load times, due to swapping.
D.
It requires increasing the thread_cache_size variable.easy2hide start{reply_to_this=true}答案:CDeasy2hide end
...继续阅读
(71)
发表于
2015-09-03 03:12:29
MySQL 5.6 Database Administrator-066-Which two methods will restore data to the t1 table?
In a test database, you issue the SELECT … INTO OUTFILE statement to create a file with your
t1 table data.
You then TRUNCATE this table to empty it.
Mysql> SELECT * INTO OUTFILE ‘/tmp/t1.sql’ from t1;
mysql> TRUNCATE t1;
Which two methods will restore data to the t1 table?
A.
Mysql> LOAD DATA INFILE ‘/tmp/t1.sql’ INTO TABLE t1;
B.
$ mysqladmin – u root – p – h localhost test – restore /tmp/t1.sql
C.
$ mysql – u root – p – h localhost test < /tmp/t1.sql
D.
$ mysqlinport – u root – p – h localhost test /tmp/t1.sql
E.
Mysql> INSERT INTO t1 VALUES FROM ‘/tmp/t1.sql’;easy2hide start{reply_t
...继续阅读
(31)
发表于
2015-09-03 03:12:29
MySQL 5.6 Database Administrator-066-Which two methods will restore data to the t1 table?
In a test database, you issue the SELECT … INTO OUTFILE statement to create a file with your
t1 table data.
You then TRUNCATE this table to empty it.
Mysql> SELECT * INTO OUTFILE ‘/tmp/t1.sql’ from t1;
mysql> TRUNCATE t1;
Which two methods will restore data to the t1 table?
A.
Mysql> LOAD DATA INFILE ‘/tmp/t1.sql’ INTO TABLE t1;
B.
$ mysqladmin – u root – p – h localhost test – restore /tmp/t1.sql
C.
$ mysql – u root – p – h localhost test < /tmp/t1.sql
D.
$ mysqlinport – u root – p – h localhost test /tmp/t1.sql
E.
Mysql> INSERT INTO t1 VALUES FROM ‘/tmp/t1.sql’;easy2hide start{reply_t
...继续阅读
(39)
发表于
2015-09-03 03:11:12
MySQL 5.6 Database Administrator-065-What are three facts about backups with mysqldump?
What are three facts about backups with mysqldump?
A.
Can back up a remote database server
B.
Allow a consistent backup to be taken
C.
Are always faster to restore than binary backups
D.
Are able to back up specific items within a database
E.
Create automatically compressed backups
F.
Will lock all storage engines for duration of backupeasy2hide start{reply_to_this=true}答案:ABDeasy2hide end
...继续阅读
(46)
发表于
2015-09-03 03:11:12
MySQL 5.6 Database Administrator-065-What are three facts about backups with mysqldump?
What are three facts about backups with mysqldump?
A.
Can back up a remote database server
B.
Allow a consistent backup to be taken
C.
Are always faster to restore than binary backups
D.
Are able to back up specific items within a database
E.
Create automatically compressed backups
F.
Will lock all storage engines for duration of backupeasy2hide start{reply_to_this=true}答案:ABDeasy2hide end
...继续阅读
(49)
发表于
2015-09-03 03:10:35
MySQL 5.6 Database Administrator-064-Which two changes would ensure that the temporary table does not propagate to the slave?
You want to create a temporary table named OLD_INVENTORY in the OLD_INVENTORY
database on the master server. This table is not to be replicated to the slave server.
Which two changes would ensure that the temporary table does not propagate to the slave?
A.
Use the – replicate-do-db, — replicate-do-table, or – replicate-wild-do-table option with the value
equal to OLD_INVENTORY.
B.
Change the binlog_format option to ROW and restart mysqld before you create the
OLD_INVENTORY table.
C.
Stop SQL_THREAD on the slave until you have finished using the OLD_INVENTORY
temporary table.
D.
Set binl
...继续阅读
(175)
发表于
2015-09-03 03:10:35
MySQL 5.6 Database Administrator-064-Which two changes would ensure that the temporary table does not propagate to the slave?
You want to create a temporary table named OLD_INVENTORY in the OLD_INVENTORY
database on the master server. This table is not to be replicated to the slave server.
Which two changes would ensure that the temporary table does not propagate to the slave?
A.
Use the – replicate-do-db, — replicate-do-table, or – replicate-wild-do-table option with the value
equal to OLD_INVENTORY.
B.
Change the binlog_format option to ROW and restart mysqld before you create the
OLD_INVENTORY table.
C.
Stop SQL_THREAD on the slave until you have finished using the OLD_INVENTORY
temporary table.
D.
Set binl
...继续阅读
(65)
发表于
2015-09-03 03:10:03
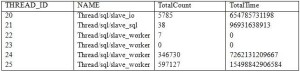
MySQL 5.6 Database Administrator-063-Which two facts can be concluded from the given output?
发表于
2015-09-03 03:10:03
MySQL 5.6 Database Administrator-063-Which two facts can be concluded from the given output?
发表于
2015-09-03 03:09:10
MySQL 5.6 Database Administrator-062-How does the MySQL server behave with incorrectly spelled options?
You adjust a default configuration to the following /etc/my.cnf on a Linux installation:
[mysqld]
Loq-bin
Binrylog_format=ROW
You do not notice the spelling error in binrylog_format and restart your production server.
How does the MySQL server behave with incorrectly spelled options?
A.
Mysqld uses internal configuration versioning and reverts to the previous configuration.
B.
When using mysql_config_editor for configuration adjustments, it detects incorrect syntax and typing mistakes.
C.
The mysqld_safe script skips the unknown variable and starts using the remaining configuration changes
...继续阅读
(74)
发表于
2015-09-03 03:09:10
MySQL 5.6 Database Administrator-062-How does the MySQL server behave with incorrectly spelled options?
You adjust a default configuration to the following /etc/my.cnf on a Linux installation:
[mysqld]
Loq-bin
Binrylog_format=ROW
You do not notice the spelling error in binrylog_format and restart your production server.
How does the MySQL server behave with incorrectly spelled options?
A.
Mysqld uses internal configuration versioning and reverts to the previous configuration.
B.
When using mysql_config_editor for configuration adjustments, it detects incorrect syntax and typing mistakes.
C.
The mysqld_safe script skips the unknown variable and starts using the remaining configuration changes
...继续阅读
(33)
发表于
2015-09-03 03:07:56
061-Which High Availability solution can provide a consistent, time-delayed (for example, one hour) snapshot of the live production database?
Which High Availability solution can provide a consistent, time-delayed (for example, one hour) snapshot of the live production database?
A.
MySQL Replication
B.
Distributed Replication Block Device
C.
Windows Server Failover Clustering
D.
MySQL Clustereasy2hide start{reply_to_this=true}答案:Aeasy2hide end
...继续阅读
(35)
发表于
2015-09-03 03:07:56
061-Which High Availability solution can provide a consistent, time-delayed (for example, one hour) snapshot of the live production database?
Which High Availability solution can provide a consistent, time-delayed (for example, one hour) snapshot of the live production database?
A.
MySQL Replication
B.
Distributed Replication Block Device
C.
Windows Server Failover Clustering
D.
MySQL Clustereasy2hide start{reply_to_this=true}答案:Aeasy2hide end
...继续阅读
(57)
发表于
2015-09-03 03:03:00
MySQL 5.6 Database Administrator-057-Which query will accomplish this?
You have enabled the Slow Query Log for a short period.
When you process the Slow Query Log, you receive the following snip of output:
Count: 100 Time=0 .22a (22s) Lock=0.00s (0s) Rows=0.0 (0), root[root] @localhost
CREATE TABLE ‘t1’ (id serial,id0 varchar(N) unique key,intcaoll INT (N)
,intco12 INT(N) ,intco13 INT(N) ,intco14 INT(N) ,intco15 INT(N)
,charcol1 VARVHAR(N) ,charcol2 VARCHAR(N) ,charcol3 VARCHAR (N)
,charcol4 VARVHAR(N) ,charcol5 VARCHAR(N) ,charcol6 VARCHAR (N)
,charcol7 VARVHAR(N) ,charcol8 VARCHAR(N) ,charcol9 VARCHAR (N) ,charcol10 VACHAR(N) )
Count: 64000 Time-0.02s (1213s) L
...继续阅读
(32)
发表于
2015-09-03 03:00:43
MySQL 5.6 Database Administrator-055-Which two requirements would lead towards a high availability solution?
Which two requirements would lead towards a high availability solution?
A.
When uptime is critical
B.
When data must be refactored
C.
When application concurrency is static
D.
When data loss is unacceptable
E.
When application is a single point of failureeasy2hide start{reply_to_this=true}答案:ADeasy2hide end
...继续阅读
(54)
发表于
2015-09-03 03:00:17
MySQL 5.6 Database Administrator-054-Which additional argument makes this operation safer?
You have forgotten the root user account password. You decide to reset the password and
execute the following:
Shell> /etc/init.d/mysql stop
Shell> /etc/init.d/mysql start – skip-grant tables
Which additional argument makes this operation safer?
A.
–skip-networking, to prohibit access from remote locations
B.
–reset-grant-tables, to start the server with only the mysql database accessible
C.
–read-only,to set all data to read-only except for super users
D.
–old-passwords, to start Mysql to use the old password format while running without the grant
tableseasy2hide start{reply_to_this=tru
...继续阅读
(59)
发表于
2015-09-03 02:59:46
MySQL 5.6 Database Administrator-053-Which restore option is suitable in this scenario?
You have been notified that the ‘apps’ . ‘reports’ table has been accidentally truncated.
You have single file mysqldump backup available taken prior to the truncate. The backup contains
all the tables from the instance, and the ‘apps’ . ‘reports’ table must be restored without affecting the other remaining databases and tables.
Which restore option is suitable in this scenario?
A.
Restore the backup to another databases instance and obtain a copy of the reports table
individually.
B.
Extract the ‘apps’ . ‘reports’ table from the backup using the SOURCE command.
C.
Execute LOAD DATA INFIL
...继续阅读
(51)
发表于
2015-09-02 05:26:47
MySQL 5.6 Database Administrator-020-Which three should influence your choice of character set?
In a design situation, there are multiple character sets that can properly encode your data.
Which three should influence your choice of character set?
A.
Disk usage when storing data
B.
Syntax when writing queries involving JOINS
C.
Comparing the encoded data with similar columns on other tables
D.
Memory usage when working with the data
E.
Character set mapping index hash sizeeasy2hide start{reply_to_this=true}答案:CDEeasy2hide end
...继续阅读
(175)
发表于
2015-09-02 05:25:53
MySQL 5.6 Database Administrator-019-What effect will the new configuration have in existing accounts?
A Mysql Server has been running an existing application successfully for six months.
The my.cnf is adjusted to contain the following additional configuration:
[mysqld]
Default-authentication-plugin=sha256_password
The Mysql Server is restarted without error.
What effect will the new configuration have in existing accounts?
A.
They will have their passwords updated on start-up to sha256_password format.
B.
They will have to change their password the next time they login to the server.
C.
They are not affected by this configuration change.
D.
They all connect via the secure sha256_password
...继续阅读
(133)
发表于
2015-09-02 05:25:09
MySQL 5.6 Database Administrator-018-Which statement is true about this scenario?
You install a copy of Mysql 5.6.13 on a brand new Linux server by using RPM packages. The
server starts successfully as verified by the following commands:
$ pidof mysqld
3132
$tail – n2 /var/lib.mysql/hostname.err
2013-08-18 08:18:38 3132 [Note] /usr/sbin/mysqld: ready for connections.
Version: ‘5.6.13-enterprise-commercial-advaced’ socket: ‘/tmp/mysql.sock’ port;
3306 Mysql Enterprise Server – Advanced Edition (Commercial)
You attempt to log in as the root user with the following command:
$mysql –u root
ERROR 1045 (28000): Access denied for user ‘root’@’localhost’ (using password: NO)
Whi
...继续阅读
(179)
发表于
2015-09-02 05:24:17
MySQL 5.6 Database Administrator-017-Which two methods would you use to find out?
Assume that you want to know which Mysql Server options were set to custom values.
Which two methods would you use to find out?
A.
Check the configuration files in the order in which they are read by the Mysql Server and
compare them with default values.
B.
Check the command-line options provided for the Mysql Server and compare them with default
values.
C.
Check the output of SHOW GLOBAL VARIABLES and compare it with default values.
D.
Query the INFORMATION_SCHEMA.GLOBAL_VARIABLES table and compare the result with
default values.easy2hide start{reply_to_this=true}答案:CDeasy2hide end
...继续阅读
(46)
发表于
2015-09-02 05:23:14
MySQL 5.6 Database Administrator-016-What are four capabilities of the mysql client program?
What are four capabilities of the mysql client program?
A.
Creating and dropping databases
B.
Creating, dropping, and modifying tables and indexes
C.
Shutting down the server by using the SHUTDOWN command
D.
Creating and administering users
E.
Displaying replication status information
F.
Initiating a binary backup of the database by using the START BACKUP commandeasy2hide start{reply_to_this=true}答案:ABDEeasy2hide end
...继续阅读
(49)
发表于
2015-09-02 05:21:42
MySQL 5.6 Database Administrator-015-Which two methods will clear or reset the collected events in the tables?
Consider the events_% tables in performance Schema.Which two methods will clear or reset the collected events in the tables?
A.Using DELETE statements, for example, DELETE FROM
performance_schema.events_watis_current;
B.Using the statement RESET PERFORMANCE CACHE;
C.Using the statement FLUSH PERFORMANCE CACHE;
D.Using TRUNCATE statements, for example, TRUNATE TABLE
performance_schema.events_waits_current;
E.Disabling and re-enabling all instruments
F.Restarting Mysqleasy2hide start{reply_to_this=true}答案:DEeasy2hide end
...继续阅读
(93)
发表于
2015-09-02 05:20:08
MySQL 5.6 Database Administrator-014-What is the expected outcome?
You execute the following statement in a Microsoft Windows environment. There are no conflicts in the path name definitions.
C: \> mysqld – install Mysql56 – defaults – file = C : \my –opts.cnf
What is the expected outcome?
A.Mysqld acts as an MSI installer and installs the Mysql 5.6 version, with the c: \my-opts.cnf
configuration file.
B.Mysql is installed as the Windows service name Mysql56, and uses c: \my-opts.cnf as the
configuration file
C.An error message is issued because – install is not a valid option for mysqld.
D.A running Mysql 5.6 installation has its runtime configuration
...继续阅读
(55)
发表于
2015-09-02 05:17:43
MySQL 5.6 Database Administrator-013-How many events are added to the audit log as a result of the preceding statements?
Consider the Mysql Enterprise Audit plugin.
A CSV file called data.csv has 100 rows of data.
The stored procedure prepare_db ( ) has 10 auditable statements.
You run the following statements in the mydb database:
Mysql> CALL prepare_db ( );
Mysql> LOAD DATA INFILE ‘/tmp/data.cav’ INTO TABLE mytable;
Mysql> SHOW TABLES;
How many events are added to the audit log as a result of the preceding statements?
A.
102; top-level statements are logged, but LOAD DATA INFILE is logged as a separate event.
B.
3; only the top-level statements are logged.
C.
111; top-level statements and all lower-level s
...继续阅读
(36)